Data collection 2001-2014
All data was collected and tested from the 28/08/10 - 02/09/14.
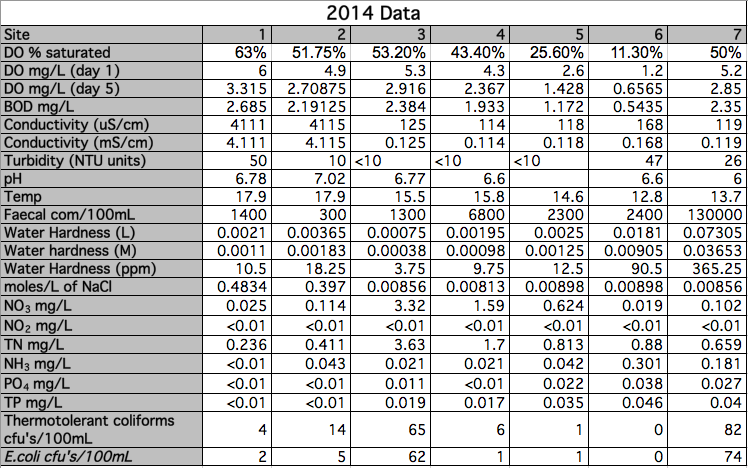
2014 lab data
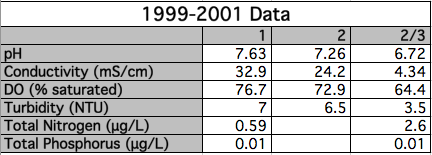
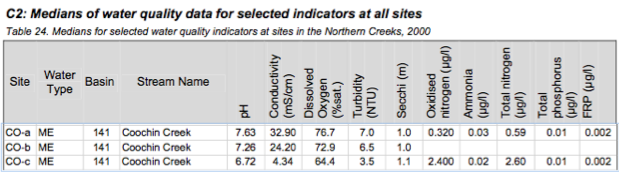
1999 - 2001 Data
Queensland Environmental Protection Agency for The Caboolure Shire Council 1999-2001
Results
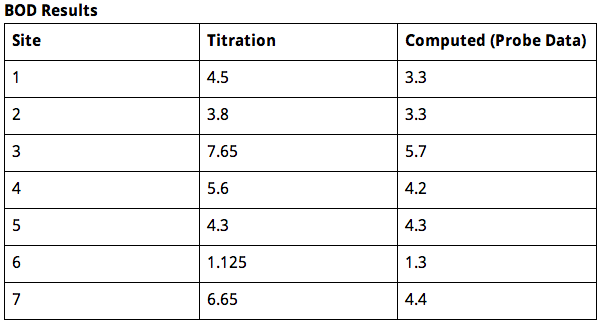
Dissolved Oxygen/Biological Oxygen Demand:
To find Biological Oxygen Demand, take DO from 5 days after collection and take away from DO of first collection.
Dissolved oxygen has decreased dramatically over the years. Dissolved oxygen at all sites is very low and must be caused by increased
Conductivity:
There was a problem with data collection from sites 1 and 2. There was a great difference between the historical data and the data collected in 2014. It was concluded that this inaccuracy might be due to an error in recording the data with the probe or the historical units may have been wrong. At all other sites, excluding 1 and 2, all conductivity measurements were relatively good considering salt levels and location.
Turbidity:
The turbidity of all sites has dramatically increased. This could be a sign of pollution and may be caused by increased boating, recreational activities, soil runoff and flooding.
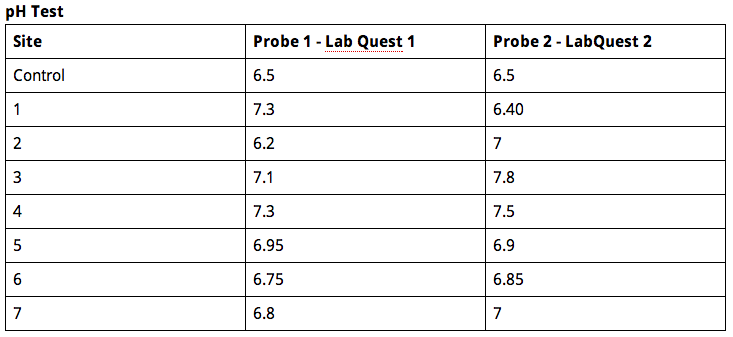
pH:
The pH levels have not changed much from 2001. All levels are almost perfectly neutral, none being too acidic or basic.
Temp:
*No comparative data
All temperature at each site were as expected. Judging by air temperature and the amount of sunlight and tree cover, each site was at a reasonable temperature.
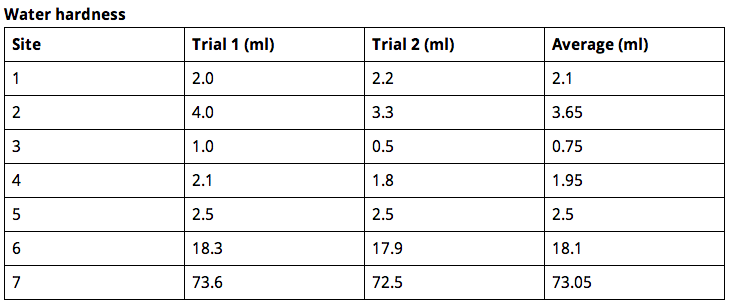
Water hardness:
*No comparative data
Water hardness varies greatly at each site and could be caused by the different environments at each site. Site 7 had fairly high water hardness and this may be caused by dissolved calcium in the water from fertilizers used at surrounding farms.
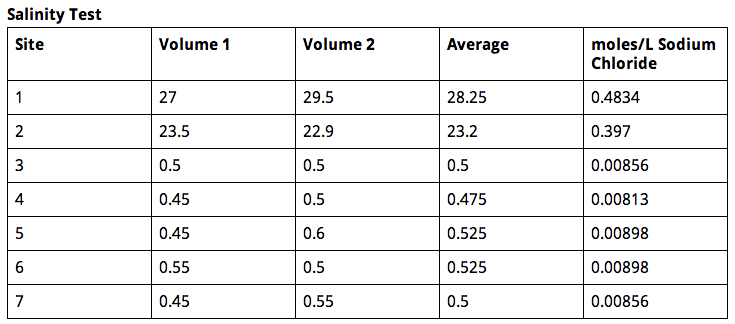
Salinity:
*No comparative data
Recent data shows that most site salinity levels are at expected levels and are appropriate for the location.
Total nitrogen:
Nitrogen was difficult to examine, because the historical data and the data from 2014 did not match at all. This may have been inaccuracies in the measuring or one party may have used the wrong units. If all readings were measured in Total Nitrogen mg/L, all sites would of been in an acceptable range of 100-750μg/L. Nitrate (NO3-) reactions in fresh water can also cause oxygen depletion. This can cause many aquatic organisms to die. The main causes of increased nitrogen in water can be caused from industrial waste water, septic tanks, animal wastes and discharge from car exhausts.
Total Phosphorus:
The same problems with the nitrogen also occurred with the total phosphorus readings. Australian water quality guidelines suggest 10-100μg/L of total phosphorus in rivers and streams. Sites 5-7 had fairly high phosphorus readings of 35-46 μg/L compared to other sites. This may have been due to run off from nearby farms. Aquatic vegetation and algae thrive in waters containing high amounts of phosphates. This rapid and wild growth can choke waterways and use up large amounts of oxygen. This condition is known as 'eutrophication'. This swift growth of aquatic vegetation can deplete dissolved oxygen levels which can then lead to the death and decay of vegetation and aquatic life.
Thermo-tolerant coliforms:
*No comparative data
According to Department of Primary Industries NSW, the acceptable limit for secondary contact (boating, fishing etc.) of thermo-tolerant coliforms is <1000/100mL. All sites were well under this limit the highest being 82 and the lowest being 0.
E.coli coliforms:
*No comparative data
According to the Pine Rivers Shire Councils 'The Stream Health Manual', acceptable limits of E.coli for pre-harvest water (contacting harvestable part of a crop) were <126/100ml. All sites were under this guideline, the highest reading being 74 and the lowest being 0. Sites 3 and 7 were the highest recordings and both were taken from agricultural farmland damn, the cause for these fairly high readings is uncertain.
To find Biological Oxygen Demand, take DO from 5 days after collection and take away from DO of first collection.
Dissolved oxygen has decreased dramatically over the years. Dissolved oxygen at all sites is very low and must be caused by increased
Conductivity:
There was a problem with data collection from sites 1 and 2. There was a great difference between the historical data and the data collected in 2014. It was concluded that this inaccuracy might be due to an error in recording the data with the probe or the historical units may have been wrong. At all other sites, excluding 1 and 2, all conductivity measurements were relatively good considering salt levels and location.
Turbidity:
The turbidity of all sites has dramatically increased. This could be a sign of pollution and may be caused by increased boating, recreational activities, soil runoff and flooding.
pH:
The pH levels have not changed much from 2001. All levels are almost perfectly neutral, none being too acidic or basic.
Temp:
*No comparative data
All temperature at each site were as expected. Judging by air temperature and the amount of sunlight and tree cover, each site was at a reasonable temperature.
Water hardness:
*No comparative data
Water hardness varies greatly at each site and could be caused by the different environments at each site. Site 7 had fairly high water hardness and this may be caused by dissolved calcium in the water from fertilizers used at surrounding farms.
Salinity:
*No comparative data
Recent data shows that most site salinity levels are at expected levels and are appropriate for the location.
Total nitrogen:
Nitrogen was difficult to examine, because the historical data and the data from 2014 did not match at all. This may have been inaccuracies in the measuring or one party may have used the wrong units. If all readings were measured in Total Nitrogen mg/L, all sites would of been in an acceptable range of 100-750μg/L. Nitrate (NO3-) reactions in fresh water can also cause oxygen depletion. This can cause many aquatic organisms to die. The main causes of increased nitrogen in water can be caused from industrial waste water, septic tanks, animal wastes and discharge from car exhausts.
Total Phosphorus:
The same problems with the nitrogen also occurred with the total phosphorus readings. Australian water quality guidelines suggest 10-100μg/L of total phosphorus in rivers and streams. Sites 5-7 had fairly high phosphorus readings of 35-46 μg/L compared to other sites. This may have been due to run off from nearby farms. Aquatic vegetation and algae thrive in waters containing high amounts of phosphates. This rapid and wild growth can choke waterways and use up large amounts of oxygen. This condition is known as 'eutrophication'. This swift growth of aquatic vegetation can deplete dissolved oxygen levels which can then lead to the death and decay of vegetation and aquatic life.
Thermo-tolerant coliforms:
*No comparative data
According to Department of Primary Industries NSW, the acceptable limit for secondary contact (boating, fishing etc.) of thermo-tolerant coliforms is <1000/100mL. All sites were well under this limit the highest being 82 and the lowest being 0.
E.coli coliforms:
*No comparative data
According to the Pine Rivers Shire Councils 'The Stream Health Manual', acceptable limits of E.coli for pre-harvest water (contacting harvestable part of a crop) were <126/100ml. All sites were under this guideline, the highest reading being 74 and the lowest being 0. Sites 3 and 7 were the highest recordings and both were taken from agricultural farmland damn, the cause for these fairly high readings is uncertain.
